Graph
Visual Comparisons
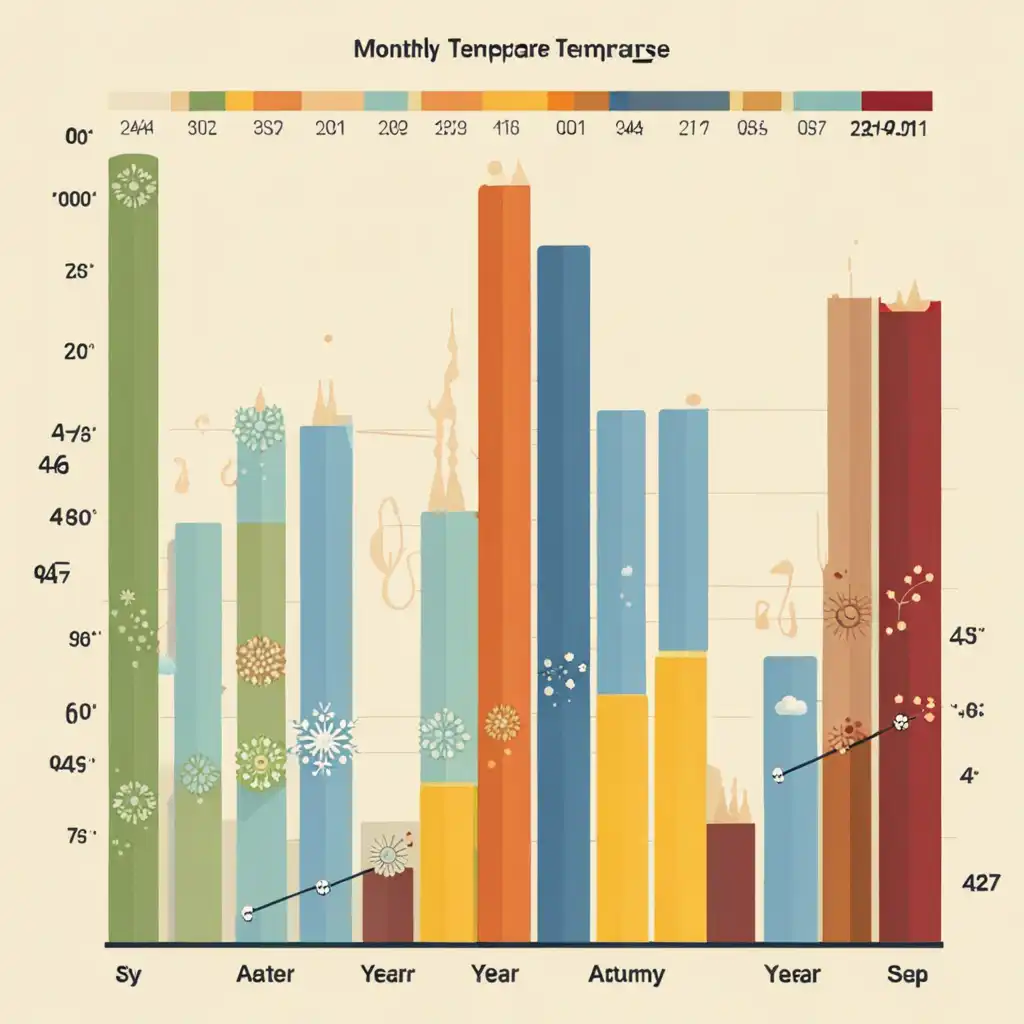
Graphs help compare quantities visually rather than in text, making differences clearer.

Look at the bar graph to easily compare company sales by quarter.
Trend Spotting
Graphs are handy to spot trends over time, such as rises or drops in temperature.

The graph illustrates a sharp increase in global temperatures since the 1950s.
Compare with
ChartDiagramFigureGraphicMapPlotRepresentationTable
WordUp Chrome Extension
As you browse the web instantly look up words you don’t know.
Get Chrome Extension


